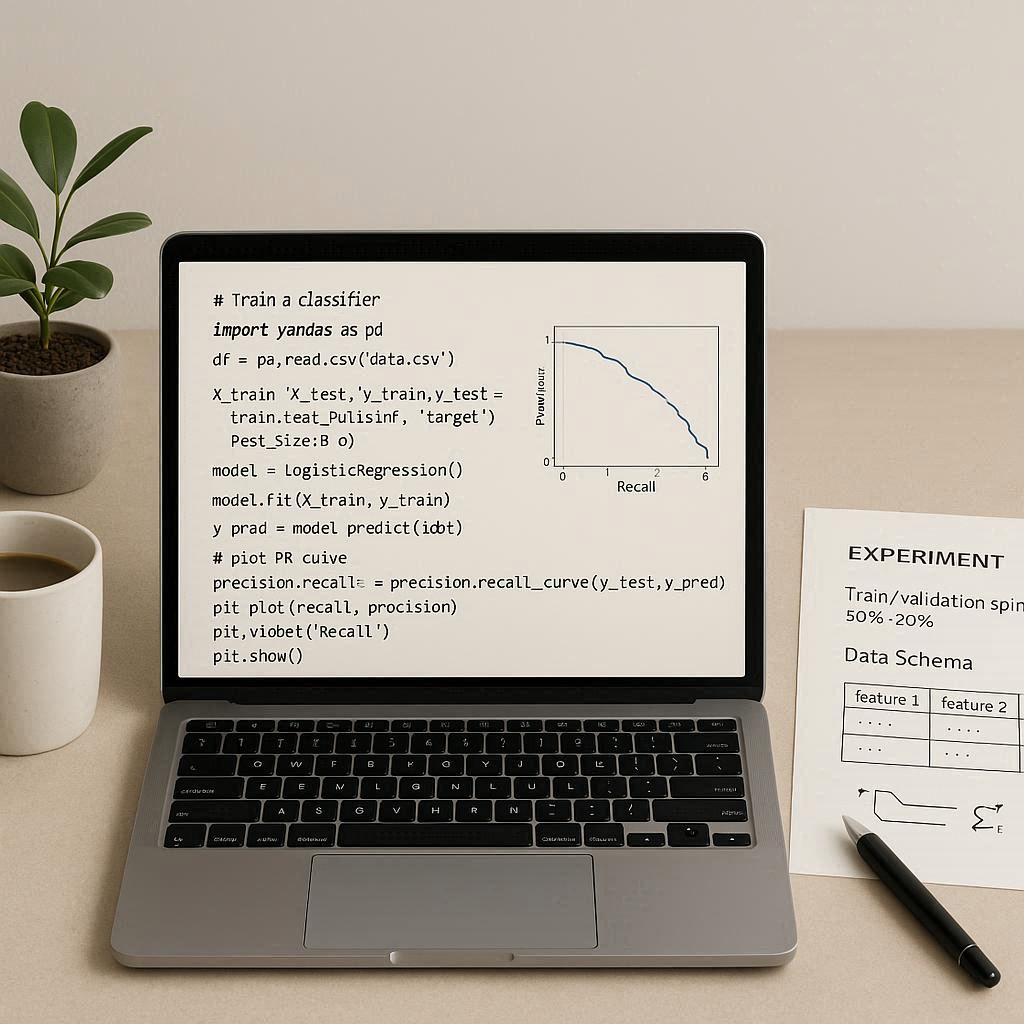
Data science is best thought of as a decision discipline. It blends statistics, programming, and domain expertise to turn raw data into actions: who to reach, what to build next, where risk hides, and how to measure impact. This article maps the terrain with a focus on concepts that outlast any particular tool.
What Data Science Actually Does
At its core, data science answers two broad questions:
- What is happening and why? Descriptive and diagnostic work: profiling datasets, building dashboards, running cohort and funnel analyses, and testing hypotheses.
- What will happen and what should we do? Predictive and prescriptive work: training models to forecast outcomes and designing interventions (offers, alerts, recommendations) that improve them.
A healthy practice cycles continuously: observe, model, ship, measure, and refine.
The Standard Workflow
- Problem definition. Translate a vague request (“reduce churn”) into a specific objective (e.g., “predict the probability a user cancels in 30 days”).
- Data acquisition. Extract from warehouses, logs, third-party APIs. Verify lineage and permissions; document assumptions.
- Cleaning and preparation. Handle missingness, anomalies, and leakage. Create features that encode domain knowledge (ratios, rolling windows, lagged signals).
- Modeling. Start simple. Baselines (means, logistic regression) create a yardstick for fancier methods (gradient boosting, neural nets).
- Evaluation. Pick metrics that reflect the decision (AUC/PR for ranking, MAE/RMSE for regression, uplift for treatment). Validate on out-of-time splits when temporal drift matters.
- Deployment. Batch scoring for periodic decisions; real-time services for interactive ones. Make the interface (API, table, or feature store) clear and stable.
- Monitoring. Track input drift, performance decay, and business KPIs. Plan for re-training and rollback.
The Tooling Landscape (Briefly)
- Languages. Python dominates for its ecosystem (pandas, scikit-learn, PyTorch). SQL is the lingua franca of data access. R excels in statistical modeling and visualization.
- Storage and compute. Warehouses (BigQuery, Snowflake) and lakes (Parquet on object stores) feed notebooks and jobs. Spark handles large-scale transforms.
- Visualization. From quick EDA plots to production dashboards, clarity beats cleverness. Label axes; show uncertainty.
Tools change; the habits—version control, reproducible environments, and documented notebooks—do not.
Statistics and ML You Actually Use
- Uncertainty. Confidence intervals and bootstrapping communicate what you don’t know.
- Bias–variance trade-off. Simpler models can win when data is thin or noisy.
- Causality vs. correlation. A/B testing, difference-in-differences, and causal graphs prevent expensive mirages.
- Regularization. Guardrails against overfitting that also improve interpretability.
Data Engineering and MLOps
Great models starve without reliable pipes. Expect to collaborate on:
- Ingestion and transformations. Schema control, backfills, and idempotent jobs.
- Feature stores. Reuse engineered signals consistently across training and serving.
- CI/CD for data. Tests for schemas, null rates, distribution shifts. Treat datasets like code.
- Governance. Access controls, PII handling, and audit trails built in, not bolted on.
Communicating Results
Influence comes from crisp narratives tied to decisions:
- State the question in business terms.
- Explain the method briefly; highlight assumptions.
- Present the result with uncertainty.
- Recommend the next action and the metric to watch.
A lucid memo can be more valuable than a complex model.
Ethics and Risk
Fairness, privacy, and safety are not optional extras. Screen training data for historical bias, document intended use, and add guardrails for misuse. When predictions impact access to resources (credit, healthcare, housing), require human oversight and clear appeal paths.
A Sensible Learning Path
- Strengthen SQL and basic stats (distributions, tests, intervals).
- Learn Python for data work; practice end-to-end mini projects.
- Study supervised learning, validation, and feature engineering.
- Add experiment design and causal inference basics.
- Ship a model: package, deploy, monitor, and iterate.
A structured curriculum can accelerate progress and reveal blind spots you might miss when self-teaching. If you prefer a guided route with projects and feedback, a well-designed data science course can provide milestones without replacing real-world practice.
What Good Portfolios Show
- Reproducibility. Clear READMEs, environment files, and data contracts.
- Trade-offs. Why this metric, this split, this threshold?
- Business framing. From model metric to money saved or users retained.
- Maintenance mindset. Monitoring notebooks, drift alerts, and retraining plans.
Bottom line: Data science is the craft of turning uncertainty into informed action. Focus on problems, measure what matters, and keep your pipeline—technical and communicative—clean and reproducible. The stack will evolve; rigorous thinking will not.
